5 Medias
What is Marketgenius?
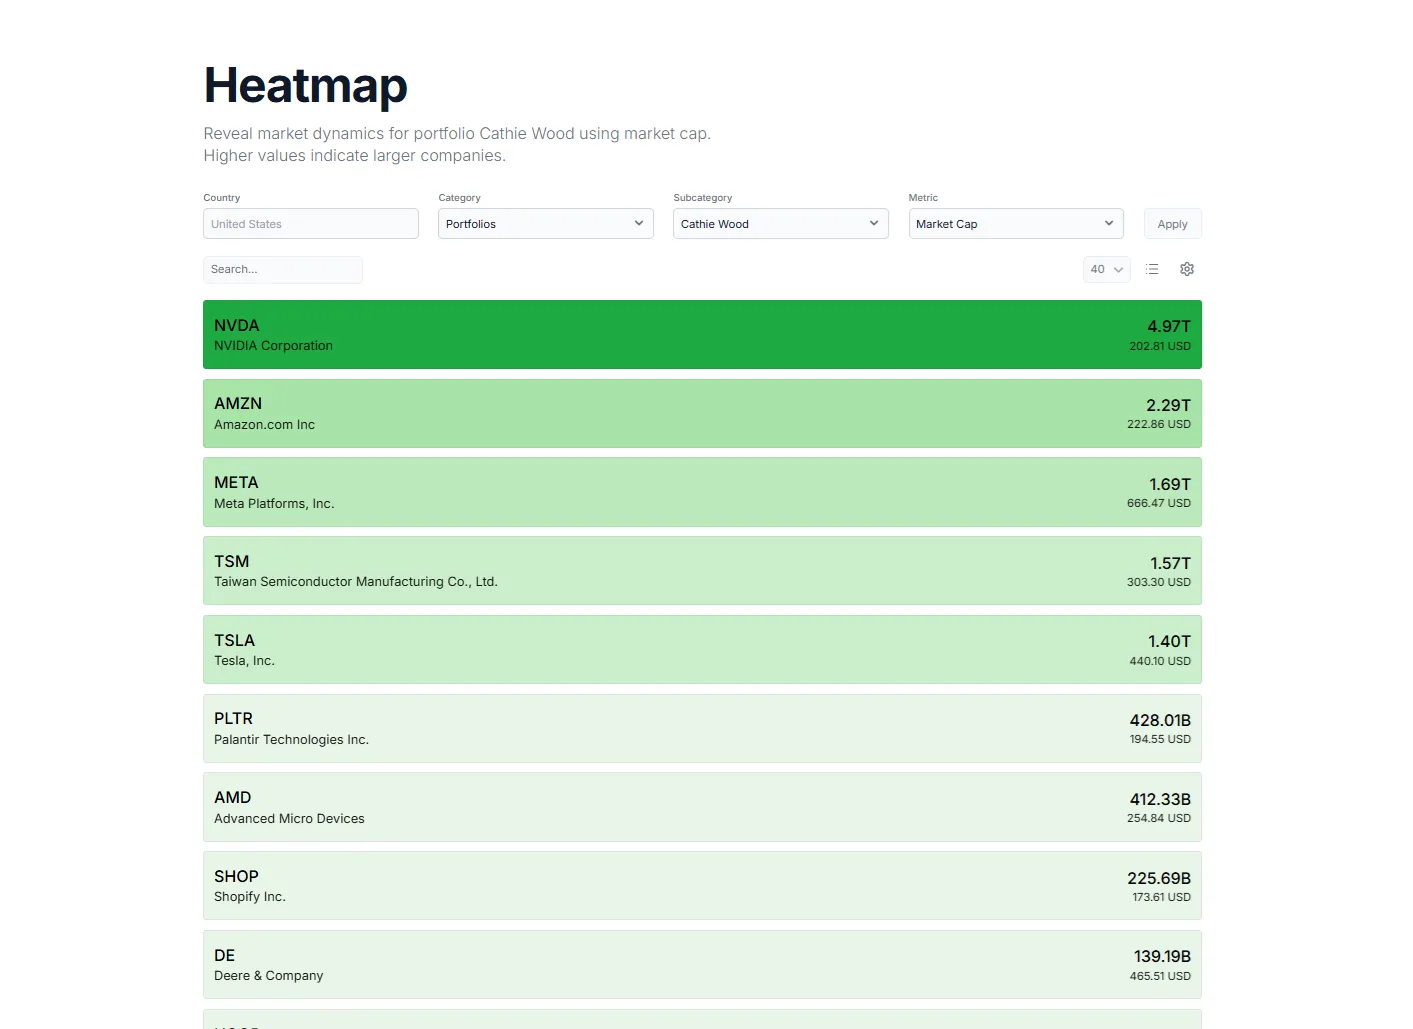
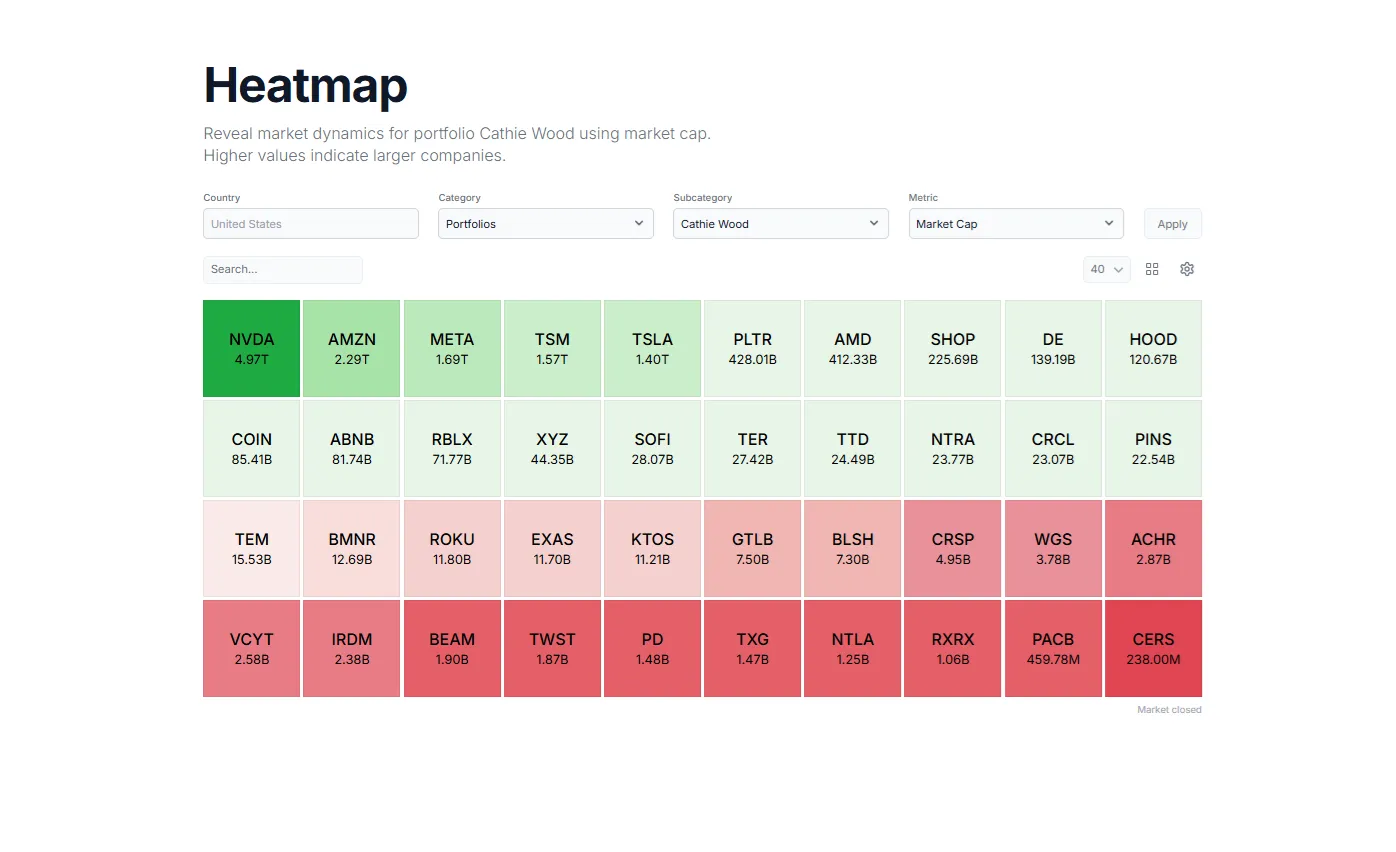
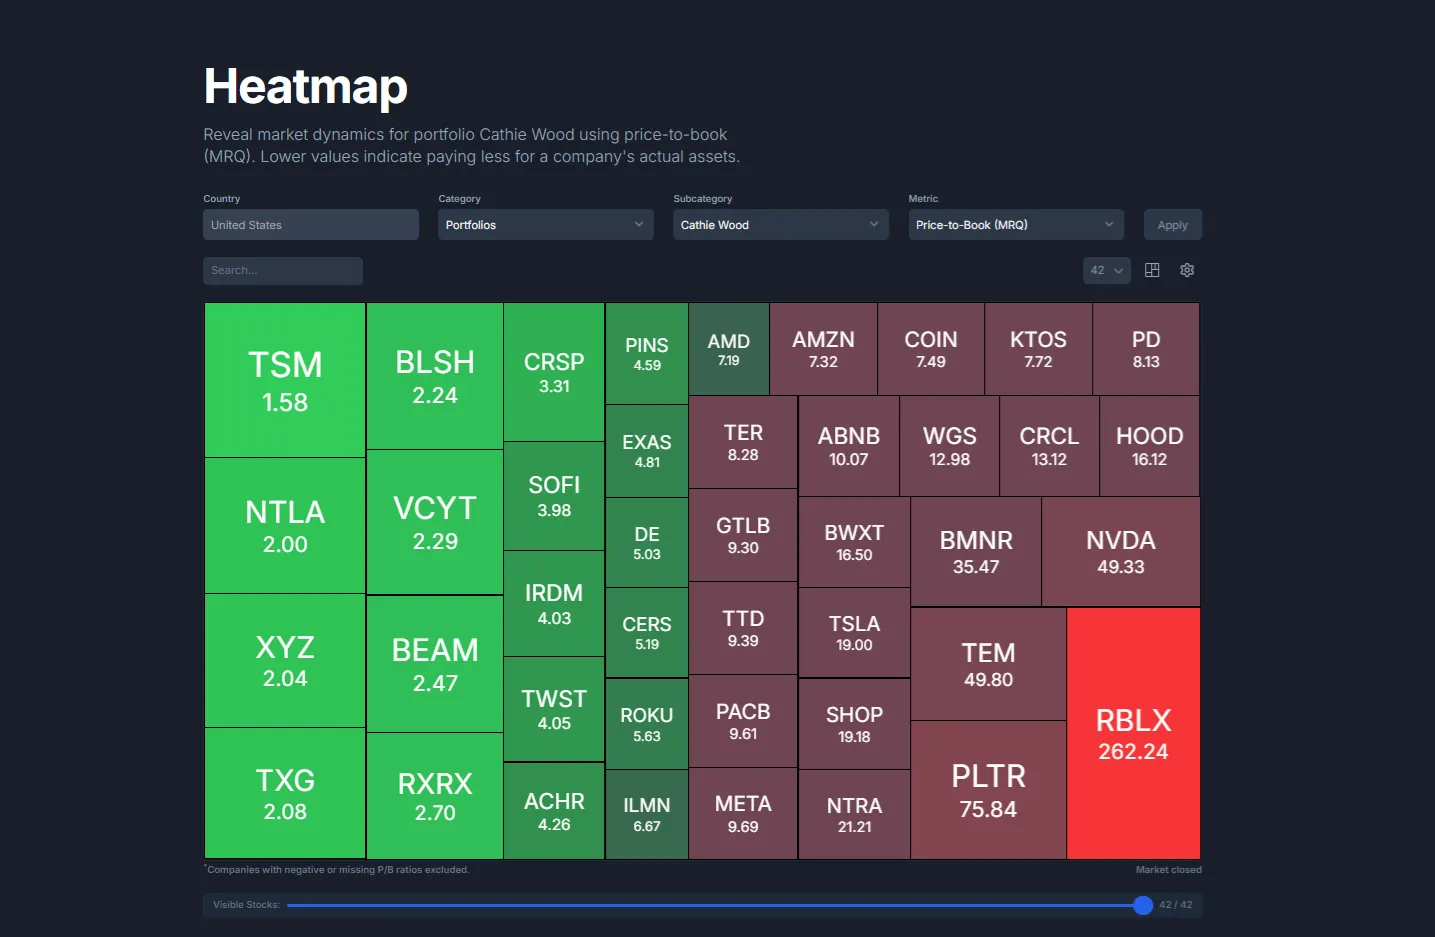
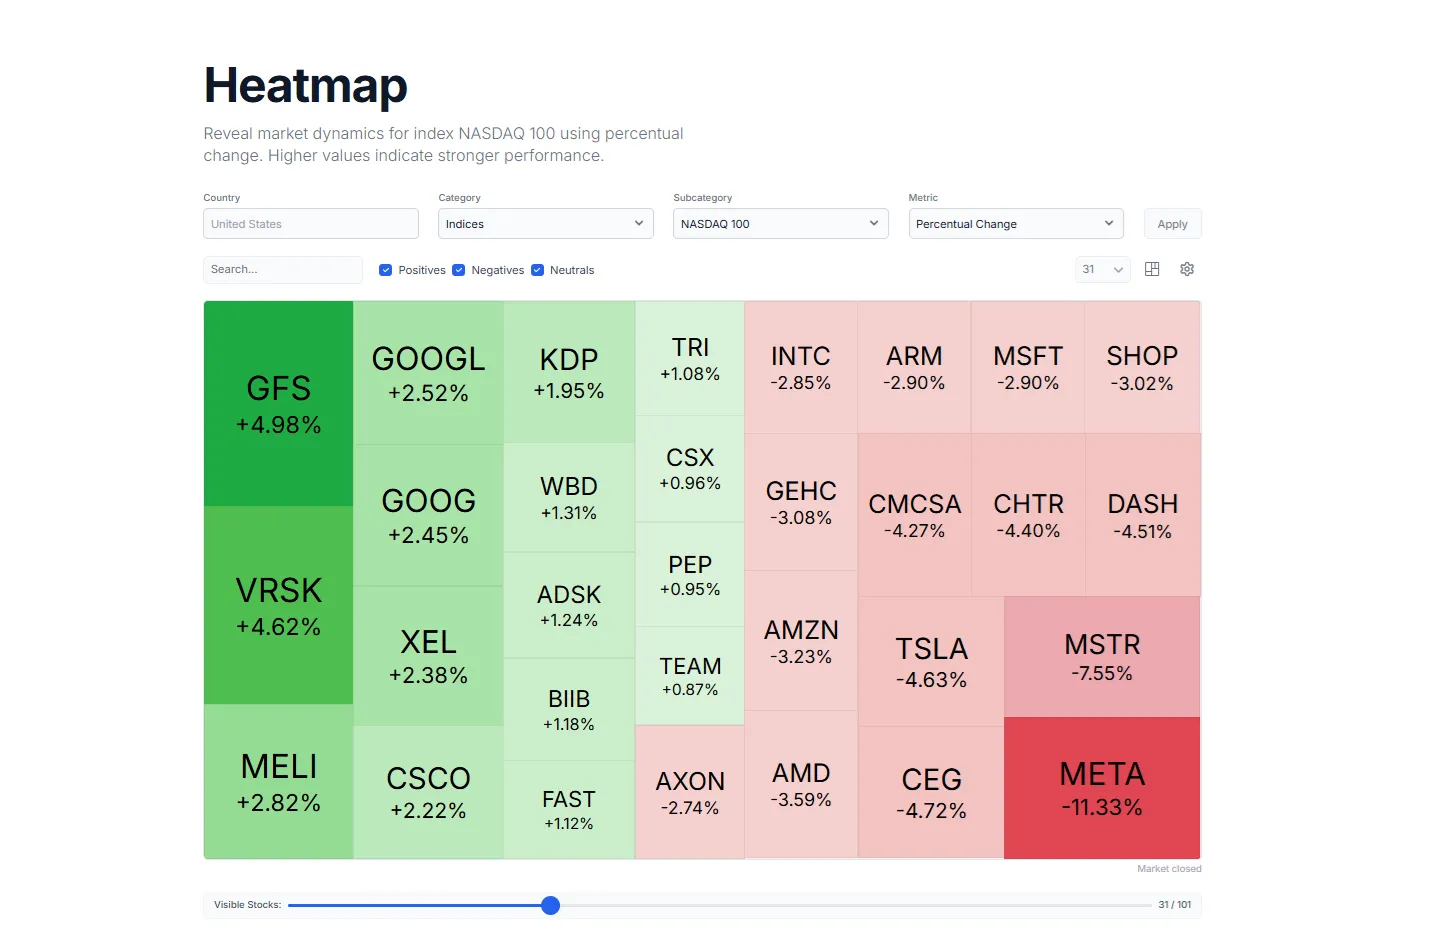
Interactive stock heatmaps that adapt to your selected metric — volume, price change, PEG ratio, and more.
Core Features
- Superinvestor Portfolio Tracking
- Real Time Stock Heatmaps
- Institutional Data Feeds
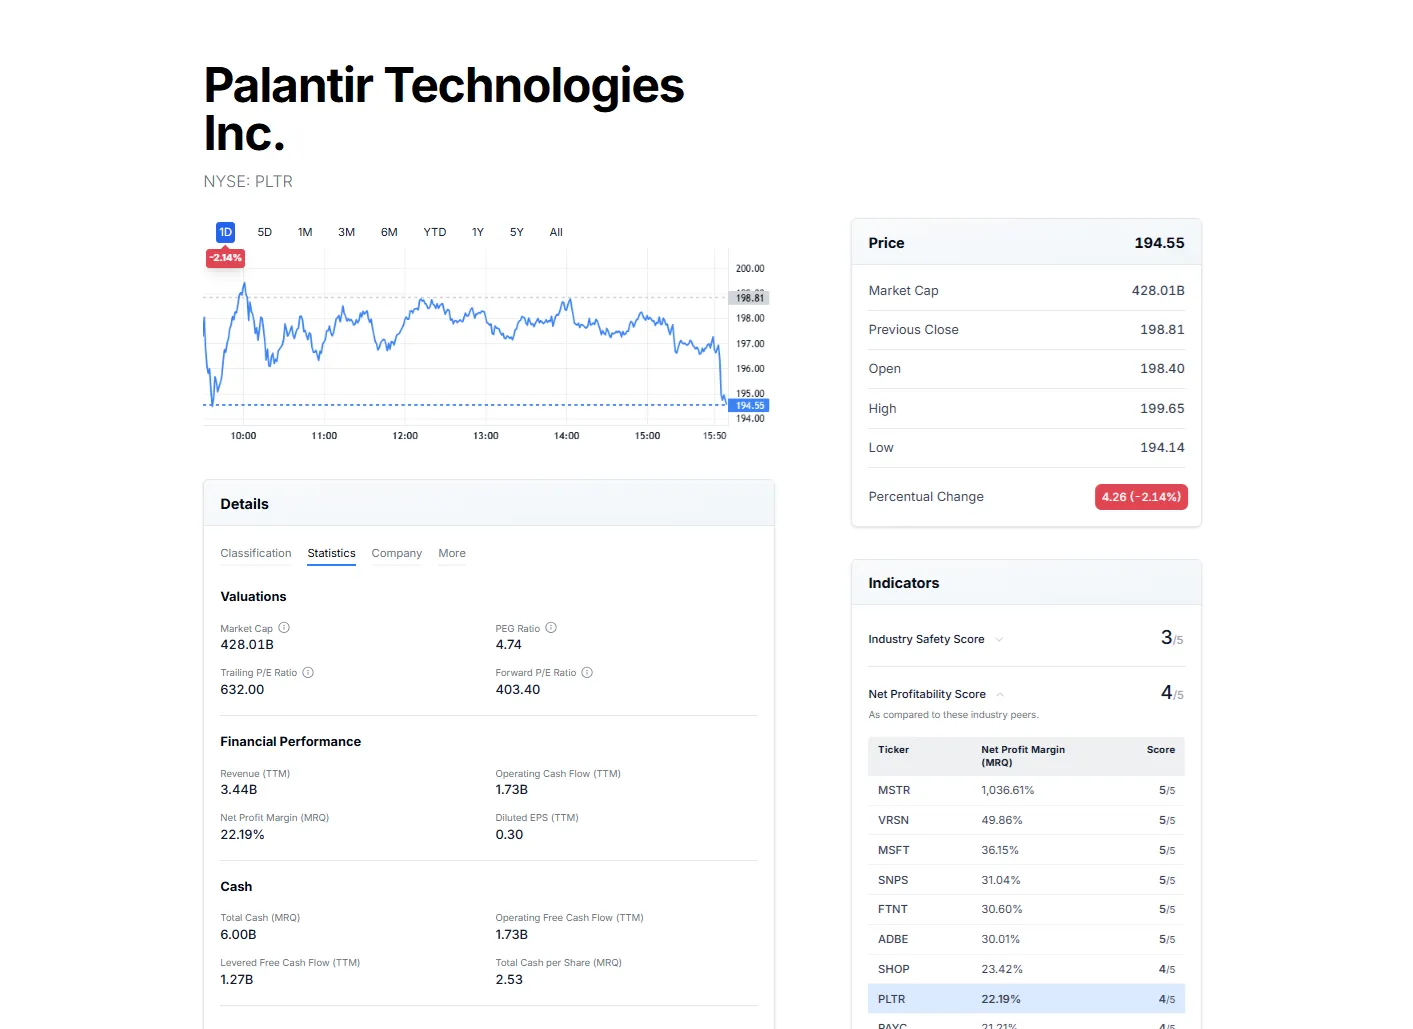
- Stock Charts
- Stock Analysis
Pricing Model
Ideal For
Entrepreneurs
Use Marketgenius as an Alternative to
AlphaSense
Finviz
TradingView
Detailed Description
Hey Next Big Product!
We spent way too much time analyzing stock heatmaps that weren't designed to reveal insights.
Most heatmaps force you to view every metric (market cap, volume, price changes) through
identical static layouts, even though these metrics tell completely different stories.
A $3 trillion company dominates the visual space even when analyzing volume or price change,
while smaller high-volume movers get buried. Switch from market cap to volume?
The layout stays exactly the same.
We asked ourselves: why should the visualization stay static when the data is dynamic?
And why is it so hard for everyday investors to extract the information we need to make educated decisions?
We rebuilt stock heatmaps from the ground up using two core principles:
- - The visualization should adapt to serve the data, not the other way around.
- - Complex information should be made clear, understandable and actionable.
Marketgenius Reviews
No reviews yet.

AMA with Maker (4)
I'm trying to get a better visual sense of market momentum—can I use your heatmap to quickly spot which sectors are seeing unusual volume spikes each day?
Great suggestion, we have discussed this and I will forward this to the team so that it might appear on our roadmap. You can follow us on X or via our newsletter for future updates.
I love the idea of adapting the map to different metrics, but how easy is it to switch between, say, price change and the PEG ratio on the fly? I don't want to get lost in a complicated menu.
Simply select the dropdown and you're good to go 😉. If I misunderstood please let me know!